Month: April 2021

  • I Want to Control Arduino with Python!

    I Want to Control Arduino with Python!

    Arduino is controlled using the Arduino language.
    Sooner or later, however, you will want to do something more complex, or to control an Arduino together with another program.

    The module introduced here, pySerial, lets you carry out serial communication with a Raspberry Pi or an Arduino.
    Through serial communication, you can send commands from a Python program to an Arduino or Raspberry Pi and control them from Python.

    Here I introduce the basic program for doing this.
    Just being able to use it will greatly expand what you can do with your programs.

    Installation

    pip install pyserial

    You can install it by opening Python in a terminal or command prompt.
    Alternatively, you can install it from a terminal in an IDE such as PyCharm.

    Example program

    This example turns an LED on and off at one-second intervals.
    I will test it by driving pin 13, which is connected to the LED built into the Arduino.
    The Python program looks like this:

    import serial, time
    
    def main():
        #  COMポートを開く
        print("Open Port")
        ser = serial.Serial("COM3", 9600)
        while True:
            #  LED点灯
            ser.write(b"1")
            time.sleep(1)
            #  LED消灯
            ser.write(b"0")
            time.sleep(1)
    
        print("Close Port")
        ser.close()
    
    if __name__ == '__main__':
        main()

    Use serial.Serial to specify the port and the serial communication settings.
    For the Arduino UNO, specify 9600.
    This differs from board to board, so check it in the Arduino IDE.

    The b in b”1″ plays a crucial role.
    With the serial.write() function, numbers and strings must be converted to byte sequences before they can be sent over serial communication.
    The b prefix is needed to indicate that the value is a byte sequence.

    Since this program is an infinite loop, the LED keeps switching on and off every second until you stop the program.

    Next is the program on the Arduino side.

    void setup() {
      Serial.begin(9600);
      pinMode(13, OUTPUT);
      digitalWrite(13, LOW);  //  初期化
    }
    
    void loop() {
      byte var;
      var = Serial.read();
      switch(var){
        case '0':
          digitalWrite(13, LOW);
          break;
        case '1':
          digitalWrite(13, HIGH);
          break;
        default:
          break;
      }
    }

    Here I use a switch-case statement.
    It makes the program easier to follow.
    For details, take a look at my previous blog post.

    In this program, sending 0 sets the pin LOW and sending 1 sets it HIGH.
    Using this program as a base, you can control an Arduino from a Python program in all sorts of ways.

  • The switch-case statement in the Arduino language

    The switch-case statement in the Arduino language

    When you want to branch on various conditions in Arduino, you probably write almost everything with if statements.
    But what should you do when you have 10 or 20 branches (unlikely as that may be)?

    C/C++ has a switch statement, and since the Arduino language is based on C/C++, you can use the same syntax.

    Here is an example program.

    switch (var) {
      case 1:
        // varが1のときに実行する処理
        break;
      case 2:
        // varが1のときに実行する処理
        break;
      default: 
        // どのcaseラベルにも一致しないときに実行する処理
        // defaultは、省略可能
      }

    Here var is a variable: when var is 1, the code in case 1 runs.
    When var is 2, the code in case 2 runs.
    When var is anything other than 1 or 2, the default code runs.

    The “break;” after the code in case 1 and case 2 indicates that the processing for that case has finished.
    Without it, you can run into errors.

    The reason break; is not needed in the default block is that default is the last branch, so it is obvious that it is the final block of code.
    That said, there is no rule against writing it—the program works fine either way.

    You can also omit default: itself.
    It feels much like omitting the else in an if-else statement.

    Personally, I find switch-case statements look tidier than if statements when you read the code.
    It is not particularly difficult code, so give it a try.

  • From a Talk People Sit Through to a Talk People Listen To!

    From a Talk People Sit Through to a Talk People Listen To!

    One thing you can’t avoid in university life is giving presentations.
    Not only in classes, but also in the lab, in seminars, and in club activities, there are many occasions when you have to stand up in front of people and present.

    From elementary school through high school, you mostly just sit and listen in class, and there are few chances to give a long presentation. Yet
    the moment you enter university, you are suddenly put in front of an audience again and again.

    That said, it’s also true that many people around you dislike presenting or feel they’re bad at it,
    and unfortunately there are plenty of presentations that leave the audience thinking “that was poorly done” or “that was boring.”

    So I’m going to keep posting the presentation know-how I’ve picked up during my university years.

    This time, the topic is the mindset behind giving a presentation.

    A typical trait of poor presenters is that they give a talk that the audience is made to sit through.
    For example:
    ・spending too long on a single slide
    ・leaving dead air during the talk
    ・using too many slides
    ・failing to make the connections between points clear
    and so on.

    As a rule, you should assume that the people listening have almost no motivation to listen to your talk.
    Nobody starts out interested in your presentation.

    The audience feels the way you did in middle school, sitting in the gym listening to a 30-minute speech from the principal.
    Few of us listened to those speeches with genuine curiosity every time.

    If you give a self-centered talk to an audience with no desire to listen, you may come away satisfied, but the audience will be bored.

    Some people, seeing that the audience looks unengaged, is checking their phones, or has dozed off, will fall into self-loathing and conclude that their presentation is hopeless.

    To avoid that, you need to give a talk that people actually want to listen to.

    Presentation technique matters, but what matters most for a talk people want to hear is how you yourself think about presenting.
    Once that mindset changes, your talk will naturally become audience-oriented.

    The key points for a talk people want to hear are:
    ・be clear about the single most important message of your talk
    ・keep the talk simple and minimal
    ・eliminate anything that even you find confusing or distracting
    That’s it.

    Suppose your talk contains ten points.
    If you deliver all ten with the same emphasis, the audience will retain nothing at all; but if you present just one as clearly important, the other nine may amount to zero while that one point will at least stick in their minds.

    Narrow down what you want to say, keep it short and to the point, and make it easy to follow

    Aim for a talk that people listen to naturally, rather than one that forces your views on them.
    If you keep that in mind, your presentations will improve on their own.

    If you know someone who is a good presenter, ask them all sorts of questions.
    If you don’t, watch the talks that are so often held up as models—Steve Jobs, President Obama, and the like.
    They can reach a huge number of people with words alone.
    Their technique is impressive, but above all, they are perfectly clear about what they want to convey.

  • Batch Image Processing with ImageJ (Fiji)

    In biological research, you will often image samples such as antibody-stained preparations with a confocal laser scanning microscope.

    Here I explain how to use ImageJ to turn that imaging data into a stack image (Stack) and to merge images acquired at different wavelengths into a merged image (Merge).
    I will finish by showing how to add a scale bar.

    First, with a confocal laser scanning microscope you obtain images acquired at different wavelengths (different lasers) for each single slice, and these slices span the thickness of the sample along the z axis.

    Here, combining images of different wavelengths taken at the same z position is called merging, and superimposing the images along the z axis is called stacking.
    ImageJ uses these terms in the same sense, so keep in mind what you actually want to do as you work.

    I will use Fiji in this explanation, but the procedure is largely the same in ImageJ.
    That said, Fiji can open confocal microscope image data without any format conversion, which is why I use Fiji here.

    For this example I used a confocal microscope image of a fly from flylight.
    The image used as an example

    As you can see from the files downloadable at that site, confocal microscope images use manufacturer-specific formats such as *.lsm, and these files contain a variety of information.
    Scale information is included as well, so you can insert an accurate scale bar without having to look up the microscope’s scale yourself.

    First, open Fiji and drag your imaging data onto the menu bar–like window that appears.

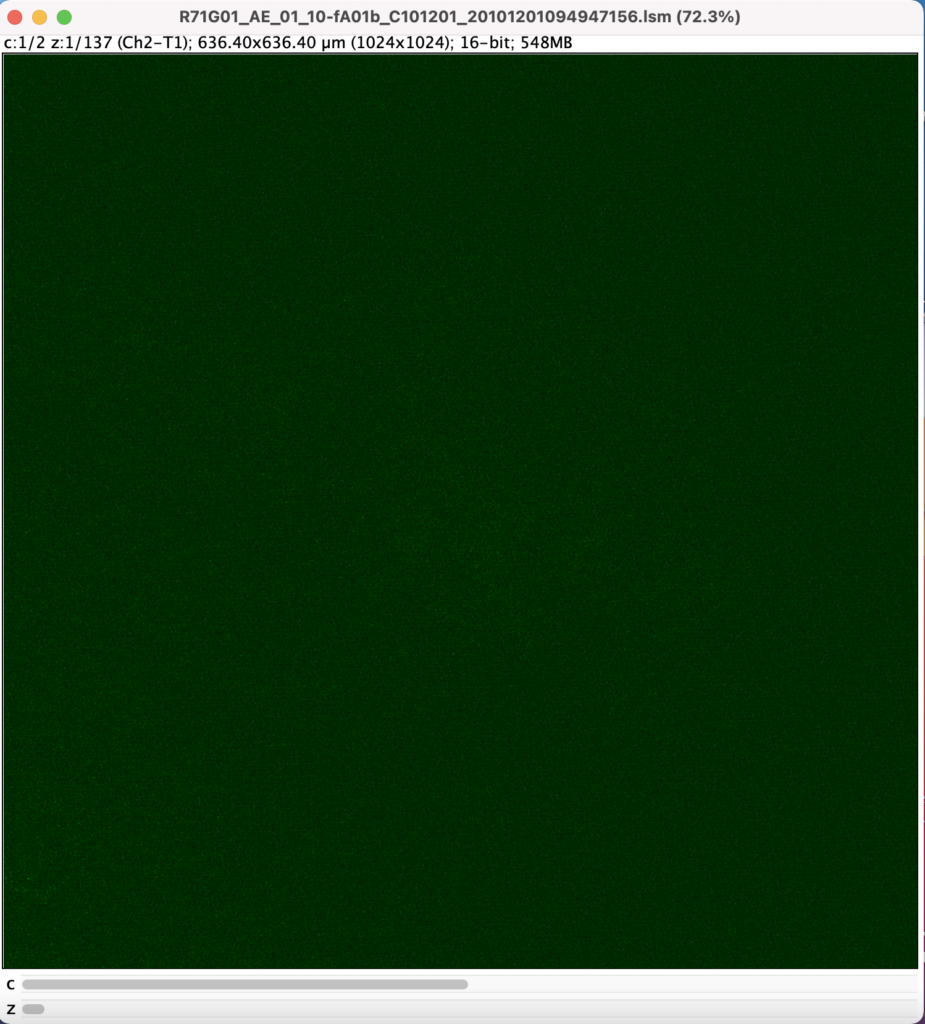
    When it opens, a new window appears showing something blackish or greenish.
    This is the image you are currently working on.
    You can move along the z axis by dragging the scroll bar at the bottom.

    Merge the images via Image<Color<Make Composite in the top menu.
    Then open the Channels Tool via Image<Color<Channels Tool.

    In the Channels Tool, you can toggle the display of each channel using the Channel checkboxes.

    To stack the images, click Image<Stacks<Z project and the images will be stacked.
    Unless you have a particular preference, set Projection Type to Sum Slices.
    A new window will then open showing the stacked image.

    The Channels Tool works here too, so you can view the stacked image for each channel.

    You can add a scale bar via Analyze<Tools<Scale Bar.
    By changing the value of “Width in 〇〇:”, you can set it to whatever length you like.

    To save the processed image, use File<Save as and specify the file format.
    For some reason images come out white when saved as Tiff, so I recommend PNG or JPEG.

    And here is the finished image.

    You can find the link to Fiji here.